

Key Takeaways
- A price shown today reflects only one moment in a product's full pricing history.
- Retailers routinely inflate reference prices to make discounts appear larger than they are.
- Price history tools let you verify whether a "sale" price is genuinely lower than normal.
- Seasonal patterns and product life cycles significantly influence when prices rise or fall.
- Tracking prices over weeks or months gives you the context needed to evaluate true value.
What you will need
Why a Single Price Tells You Almost Nothing
When you see a price tag — whether in a store aisle or on a product page — you're looking at a data point stripped of all context. You don't know if that number is unusually high, historically low, or simply the retailer's preferred anchor for manipulating perception. Without a timeline, a price is just a number.
Retailers are sophisticated about how they present prices. Strikethrough prices, "was/now" comparisons, and flash sale countdowns are all designed to create an impression of savings — regardless of whether any real discount has occurred. As decoding retail price tags shows, the number crossed out may never have been a price anyone actually paid.
Price history changes this equation. When you can see how a product was priced across weeks or months, you gain the ability to evaluate a current price against its own track record — not against a manufactured reference point chosen by the seller.
Reference Prices Are Not Neutral
The "original" or "regular" price displayed next to a sale price is chosen by the retailer, not set by a neutral third party. In some cases, products have been listed at an inflated reference price for only a brief period — or never sold at that price at all — before being permanently displayed as discounted. Regulatory standards around reference pricing vary and are not uniformly enforced, so independent verification through price history remains your most reliable safeguard.
What Price Histories Actually Reveal
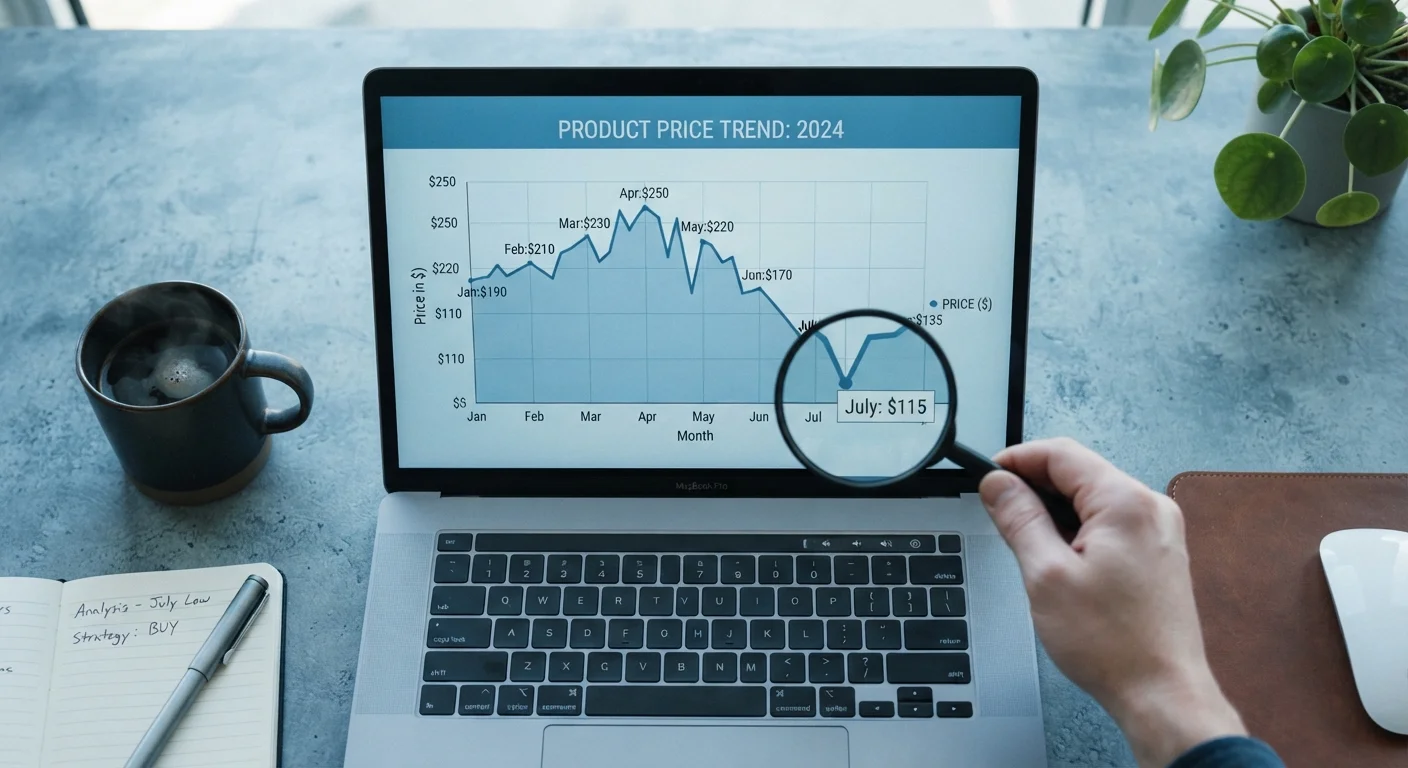
A price history chart typically plots a product's recorded price at regular intervals over a defined period — often 30, 90, or 365 days. From that chart, several patterns become readable:
- True floor prices: The lowest price a product has actually sold for, which becomes your realistic benchmark for a genuine deal.
- Pre-sale inflation: A price that rises in the days before a major sale event, then "drops" to a level that looks discounted but is actually close to or above the prior baseline.
- Seasonal cycles: Categories like electronics, bedding, and outdoor gear follow recognizable annual patterns. Understanding those cycles — covered in depth in seasonal sales cycle analysis — helps you time purchases more deliberately.
- Model transition signals: A sustained price decline often signals that a newer version is coming, which can be useful if you need the product and are comfortable with an older model.
None of this information is visible in a single price snapshot. It only becomes legible over time.
Longer Time Windows Are More Reliable
A 30-day price chart can be skewed by a single promotional event. Wherever possible, look at 90 to 365 days of history to get a realistic picture of a product's typical price range. Short windows are particularly easy for retailers to manipulate by briefly inflating prices before a sale.
How to Start Tracking Prices Effectively
Price tracking doesn't require advanced tools or significant time investment. The steps below walk through a practical approach any shopper can apply.
What you will need
Identify the exact product you want to track
Locate the precise model name, SKU, or product URL from the retailer's site. Pricing can vary significantly between color options, storage sizes, or bundle configurations — make sure you're tracking the specific variant you intend to buy, not a similar one.
Look up the product's price history
Enter the product URL or name into a publicly available price history tool. These services aggregate historical pricing data from major retailers and display it as a chart. Look for a tool that shows at least 90 days of history — longer windows give you more reliable context for evaluating where a current price sits relative to the norm.
Identify the price floor and typical price range
Once you have the chart, note three figures: the all-time low, the current price, and the most common price range over the past 90 days. If the current price is at or near the floor, that's a meaningful data point. If it's above the median range despite being labeled a sale, you have evidence the framing is misleading.
Set a price alert at your target threshold
Most price tracking tools allow you to set an alert — typically via email — that notifies you when a product drops to a price you specify. Set your alert at or below the historical floor price, or at whatever figure you've determined represents genuine value for that item. This removes the need to monitor continuously.
Factor in the broader purchase context before acting
When an alert fires or you observe a genuine low price, pause before purchasing. Confirm the product still meets your needs, check whether a newer model is imminent (which may explain the price drop), and verify that the retailer's return and warranty policies are acceptable. A good price on the wrong product or from an unreliable seller isn't a deal.
Once you've built the habit, price tracking naturally integrates with a broader understanding of price versus actual product value — because even a historically low price on the wrong product isn't a good deal.
Recognizing Tactics Designed to Shortcut Your Judgment
Price history gives you data, but understanding why retailers structure prices the way they do adds another layer of protection. The practice of anchor pricing — presenting a high reference price to make a lower price feel like a bargain — is pervasive and well-documented in consumer behavior research.
Similarly, urgency signals like countdown timers and low-stock warnings are designed to compress your decision-making window before you can do any verification. Scarcity signals in online retail are often manufactured rather than real — and price histories give you the time-independent perspective to resist them.
It's also worth recognizing that many common shopping habits — bulk buying, chasing free-shipping thresholds — can feel like smart saving while actually increasing spending. Shopping mistakes that feel like smart decisions outlines the most common patterns worth auditing in your own behavior.
Price tracking doesn't make you a perfect shopper. But it systematically removes one of the most effective levers retailers use to manufacture urgency and inflate perceived value.